Why Aurspire Exists
Aurspire’s mission is simple: bring clarity to ambiguous markets.
The Reality
BTC is volatile. Rallies reverse fast. Drawdowns arrive. Choppy markets wear people down.
The Problem
Risk often feels random in real time. Traders act without clear orientation on current conditions.
Our Focus
We don’t predict the future. We make market conditions readable with historically informed, statistically grounded risk regimes.
“I built Aurspire after seeing how often traders weren’t wrong — they were just disoriented. Markets changed regime and they didn’t have language for it. Aurspire exists to give people clarity without pretending to predict the future.”
— Founder, Aurspire
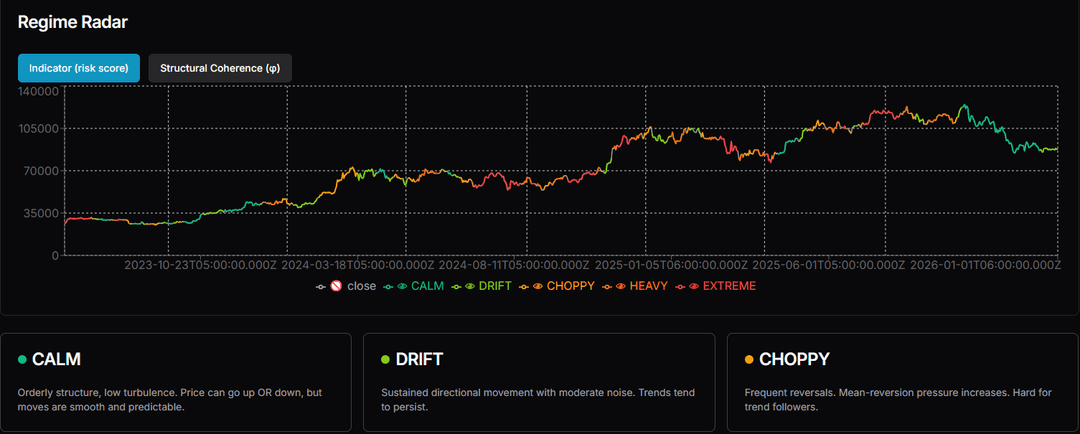
Regime Radar
| Strategy | Return | Max DD | Avg DD | Trades | Exposure |
|---|---|---|---|---|---|
BASE Trades all signals regardless of market conditions. Starting balance is 100,000 USD. | 745% | -56% | -23% | 20 | 100% |
FILTERED Applies a condition-based filter that, in historical tests, reduced drawdowns and improved risk-adjusted performance. Starting balance is 100,000 USD. | 918% | -33% | -16% | 17 | 85% |
Regiems are tested and from BTC data spanning 2020-10-31 - 2026-04-21. These values summarize past conditions and do not predict future results.
Key Features
Trend-following works—just not all the time. Aurspire helps identify when it does.
Real-Time Risk Clarity
BTC is ambiguous. Our risk regimes make current market conditions easier to read - so you don’t have to guess.
Historical Regimes
BTC changes across cycles. Compare today’s conditions to past calm, choppy, and stressed regimes.
Clear Insights
Up-to-date insights based on historical BTC market regimes across multiple cycles.
Join Our Waitlist
Be the first to access our premium features. Sign up for our waitlist today.